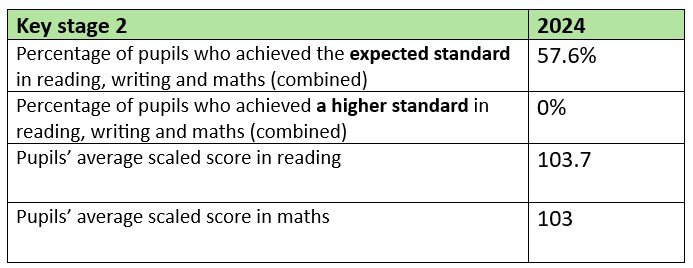
The results are reported using a scaled score. The highest possible scaled score is 120 and the lowest is 80. A scaled score of 100 represents the expected standard and a scaled score of 110+ represents the higher standard.

How are schools inspected?
Ofsted inspect schools to provide information to parents, to promote improvement and to hold schools to account for the public money they receive. School inspections are required by law. Ofsted provide an independent assessment of the quality and standards of education in schools, and check whether pupils are achieving as much as they can.
Ofsted Report - January 2025 graded inspection
Croft Primary School Ofsted inspection report January 2025
How is school performance measured?
At both primary and secondary school, the DfE focus on the progress pupils in a school make as well as their overall attainment.
At primary school the DfE looks at attainment and the progress pupils in a school make, compared to similar pupils nationally, between age 7 and age 11.
The proportion of pupils meeting the expected standard in all three of reading, writing and maths, and the average scores achieved by pupils in reading and in maths are reported. This mix of progress and attainment measures helps to understand how primary schools are equipping pupils with the building blocks of literacy and numeracy.
End of key stage 2 national tests (Year 6 SATs)
Assessments in year 6 are used to measure school performance and to make sure individual pupils are supported in the best way possible as they move into secondary school. They take place in May each year and children are assessed in reading, writing, grammar, punctuation and spelling, maths and science.
The results are reported using a scaled score. The highest possible scaled score is 120 and the lowest is 80. A scaled score of 100 represents the expected standard and a scaled score of 110+ represents the higher standard.

Department for Education Performance tables
Every year the Department for Education publishes information on the achievement and attainment of pupils in all schools. These tables provide a guide to how well a school is doing. They list National Curriculum test results for each school in England and show how they compare with other schools.
As well as our own school’s performance results you are able to access information on all schools throughout England so that you are able to see how each individual school compares with others, locally, county and nationally and against the average across the country.
The data covers a number of years and in addition to the more well-known SATs results also compares issues such as disadvantaged pupils’ comparative performance, pupil progress, pupil absence, staffing and spending etc.
To gain access to the whole range of performance tables please visit the DfE website - see link below:
DfE School Performance Website
*The information on the DfE performance website was updated in December 2024